Your favourite music streaming services provide year-end summaries of your listening habits. These summaries typically include your top playlists, artists, songs, genres, listening time, and number of songs streamed. Some services even analyze your mood based on your listening history.
This article explores how to go beyond these basic summaries and gain deeper insights from your Spotify and YouTube data. We will achieve this through data collection, cleaning, transformation, and visualization using Power BI (This can also be achieved with any analytical tool of choice).
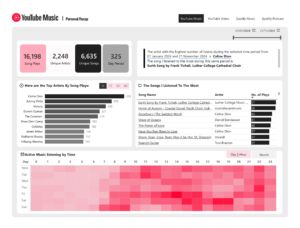
YouTube Music and Video Analysis


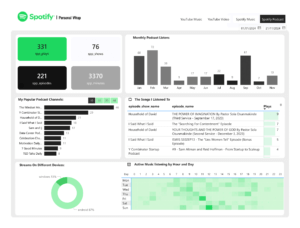
Spotify Music and Podcast Analysis
Visuals and cards show the total number of song plays, unique artists, songs, total minutes, top genres, active listening period, and top artists.
You can also see separate visuals for Spotify podcasts. More so, more customizable options are added to the visuals. For example, you can choose to see your top 10, 15, 20 or N artists. You can see the most popular genres or all of them and the months you listened to the most songs.


Data Collection
YouTube Music and Video Data
We will use Google Takeout to access your YouTube data. Google Takeout allows you to download all your Google product data, including YouTube history. The data is downloaded in JSON format.
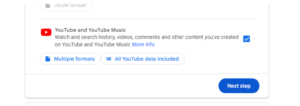
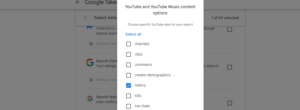
Here is what the raw JSON data looks like:
{
“header”: “YouTube Music”,
“title”: “Watched Kele”,
“titleUrl”: “https://music.youtube.com/watch?v\u003dr49K9xwf3UM”,
“subtitles”: [{
“name”: “Show Dem Camp – Topic”,
“url”: “https://www.youtube.com/channel/UCunYZtqaebaiFoML6L6wCA…}
JSON files are key and value pairs.
Key = header Value = “YouTube Music”
Key = title Value = “Watched Kele”
Spotify Music and Podcast Data:
Download your Spotify data from the Account Privacy page. Spotify will send you a compressed file containing your entire listening history. The data is provided in JSON format with accompanying documentation to explain the data columns.
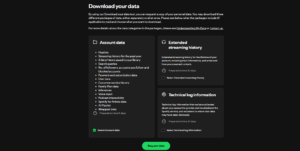
The processing of your data is anticipated to occur within a timeframe of five days, subsequent to which you will receive a compressed file (Zip file) containing a comprehensive record of your streaming history.
Since we requested extended history, Spotify provided the history for the account’s lifetime, i.e., since you joined Spotify.
Here’s what the data looks like.
{
“ts”: “2024-09-10T17:59:36Z”,
“platform”: “windows”,
“ms_played”: 171291,
“conn_country”: “NG”,
“master_metadata_track_name”: “A Bar Song (Tipsy)”,
“master_metadata_album_artist_name”: “Shaboozey”,
“master_metadata_album_album_name”: “Where I’ve Been, Isn’t Where I’m Going”,
…
}
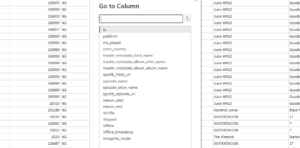
Spotify also provides documentation in your zip file to help you understand the columns in the data, which is very impressive.
Data Cleaning and Transformation using Power BI
Note: You can use any analytical tool for this step.
We will use Power BI to import and clean the data from both YouTube and Spotify. This may involve:
- Import the JSON data into PowerBI and transform it further in Power Query.
- Power Query automatically applies steps that involve the following: Converts the Data into a table > Expand and split Columns > Changed the data type.
- Removing irrelevant data points
- Adding separate columns for time, hour, and date
- Splitting columns to get separate artist and song names
Data Augmentation
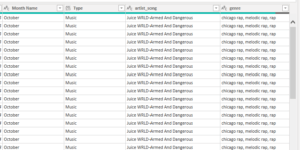
The data obtained from YouTube Takeout lacks information such as song duration and genre. Spotify didn’t also include a genre column. To address this, we can leverage external APIs like MusicBrainz or Spotify to retrieve this missing information.
Leveraging the Spotify API, we returned the duration and genre for each song row. Link to Python Code.
This data was then merged with our primary dataset.
Data Analysis
Common Analysis for Both Platforms
Measures:
Create calculated measures in Power BI to determine:
- Total number of songs
- Unique songs
- Unique artists
Visualizations:
Create the relevant charts and graphs to display:
- Songs by number of plays
- Artists by number of plays
- Number of plays by hour/day
Spotify Specific Analysis:
- Total number of podcasts listened to
- Top podcasts
- Total minutes listened to by day and artist
- Listening patterns by hour/day
Customization
This process allows you to go beyond the basic insights provided by streaming services. You can customize the analysis to view:
- Your top 10, 15, 20 or all favorite artists (instead of just the top 5)
- Listening habits across different devices
- Listening patterns by day, hour, and month
- Most popular genres or all genres listened to
- Months with the most listening activity
Conclusion
By following these steps, you can gain deeper insights into your music preferences and listening habits on YouTube and Spotify. This goes beyond the basic summaries provided by the streaming services and allows for a more personalized music exploration experience.
You can assess the Live Dashboard Here
Interested in a video describing this, subscribe to the YouTube Channel and you’ll get a notification for the video which will be published soon.
